Logs play a very important role throughout the entire life cycle of an application development as well as troubleshooting and replicating bugs on production that could lead to service interruption and harm our user’s experience.
A few months ago, I went on a journey for finding a tool that will allow me to improve logs visibility and to take action as quickly as possible, and of course with a minimum amount of effort and server requirements. I found many of them, the vast majority very appealing with endless features to the point where it started feeling somewhat overwhelmed. None of these tools however, were easy to set up and they all required a learning curve to take advantage of it’s full potential. Not to mention, the majority weren’t free and pricing will range depending on the retention period, number of instances, license, etc.
My goal was to simply run a command, get what I needed and continue with my life. All in sudden, I was hit with the aha moment! Why don’t I write a simple tool that attempts to solve the problem? So here I am, a few months after, sharing my approach at tackling this problem.
@sherlog/cli requires node >= 12.
For this example, I’m using nvm to install the minimum required version
Run the following commands in your terminal:
$ nvm install v12.16.1
$ npm install -g @sherlog/cli
Initialize the project
$ sherlog init
The previous command generates a .sherlog config file in your current working directory (no biggie, just another JSON). Fill in the blanks. Once configured, it should look similar to this.
{
  "hostname": "192.168.10.108",
  "backpressure": 1000,
  "chunks": 500,
  "compression": true,
  "files": [{
    "metric": "nginx",
    "file": "/var/log/nginx/access.log",
    "eventType": "http",
    "timezone": "UTC",
    "fromBeginning": true
  }]
}
This file can be committed to your repository to speed up the process next time you need to check your logs on different environments. Lets go ahead and start the service.
$ sherlog start
This will output the following in your terminal
Sherlog listening on:
   - Dashboard:   http://localhost:8000
   - Local:       ws://localhost:8000
   - Network:     ws://192.168.10.108:8000
Navigate to the dashboard url http://localhost:8000
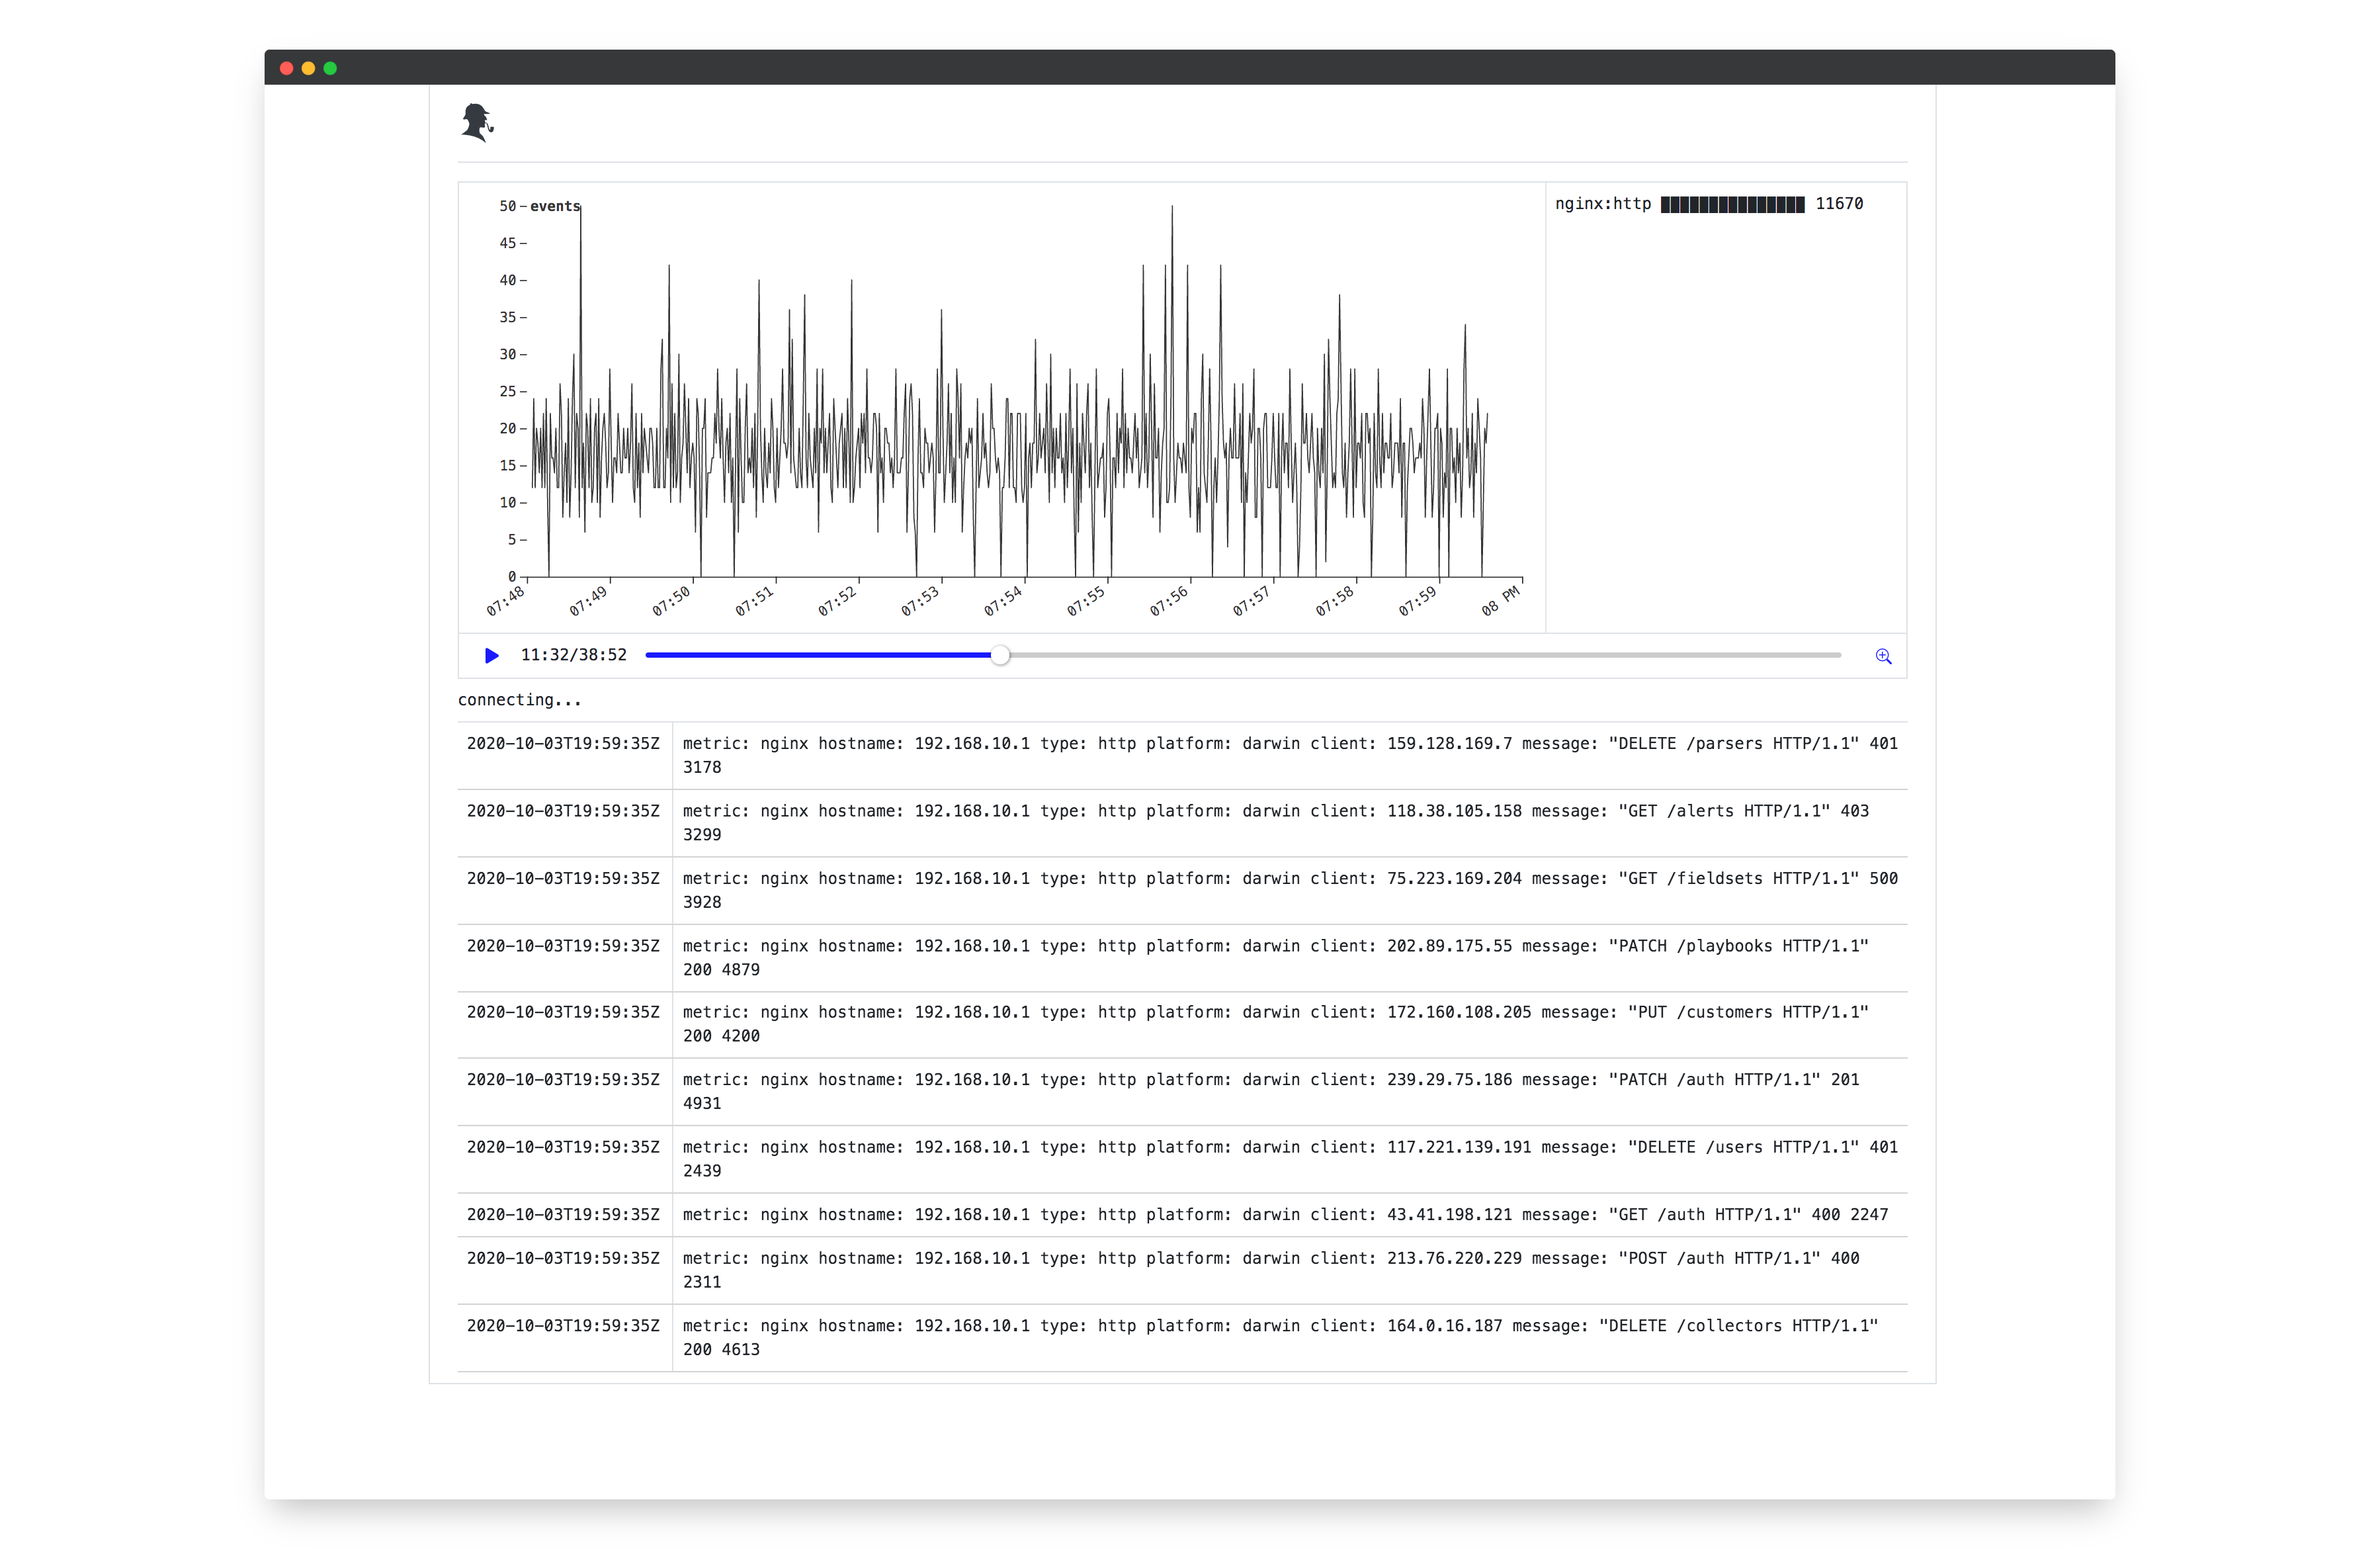
Now you can navigate through your logs as if you were watching a YouTube video going back and forth in case you missed something.
@sherlog/cli supports the following default log formats out of the box:
- Apache2
- HTTP
- Error
- Monolog (e.g. Laravel)
- Mysql
- General
- Nginx
- HTTP
- Error
- PHP-fpm
- Redis
That’s it for now folks, if you wish to get updates about @sherlog/cli and possible use cases you can follow me on Twitter @Brucelampson or feel free to submit a pull request to the project on GitHub sherl0g